
 Kontakt
 Ako nakupovať
Doručenie
Nákupný poradca
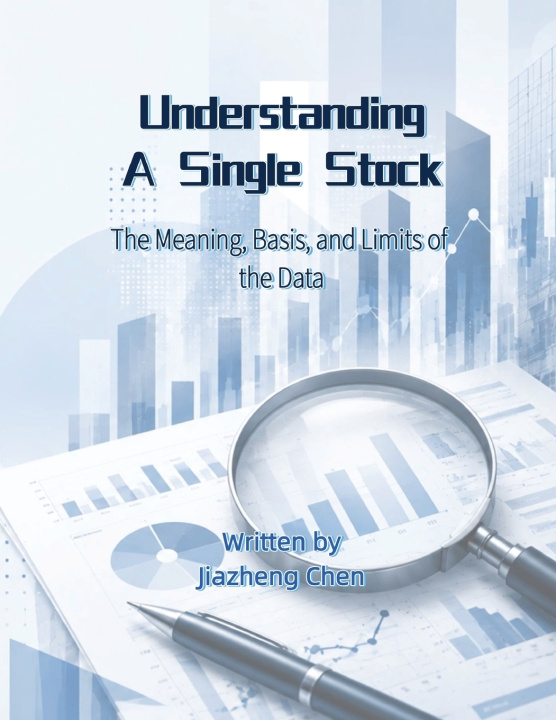
Understanding a Single Stock
The Meaning, Basis, and Limits of the Data
 Angličtina
 119 b
119 b
 Nové
Nové
Až 30 dní na vrátenie tovaru

You open your brokerage app and there are more than three hundred numbers on the screen. You probably know what five of them mean.
This book covers the other three hundred.
From the first screen of the quote page-last price, percent change, volume-through the depth of the order book and the tape; from candles and a dozen-odd technical indicators to P/E, P/B, PEG and the rest of the valuation multiples; from dividend yield, payout ratio and buyback yield to the three financial statements and thirty-odd ratios; then on to short-interest data, money flow, the options chain, analyst price targets, and the composite score the platform worked out on your behalf. The last two chapters step outside the single stock: one on the fields that belong only to ETFs, and one on how a macro number-CPI, nonfarm payrolls, PMI, the Treasury yield-actually reaches that one stock of yours, and through how many steps.
For every number, this book does three things.
First, what it is. In plain words, assuming no background in finance.
Second, how it is computed. With the arithmetic and the figures written out, so you can check it on a calculator yourself.
Third, how it can mislead you. This is the important one, and it is where the book started.
That third one is not scaremongering. The same "P/E" comes out several times apart depending on which earnings, which share count, and which year went into it. The same short-interest figure is already a snapshot from two or three weeks ago by the time you see it. The same "net large-order inflow" is something your app inferred from a rule nobody publishes. The same "technical summary: bearish" rests on thirteen votes that turn out to be four questions. None of this is a conspiracy. It is what basis, lag, and method of construction inevitably produce-and the page does not say so.
Eighteen chapters take apart more than three hundred data points, with seventy-odd tables and sixteen original black-and-white diagrams. Five appendices follow: a single-stock field reference and an ETF field reference running to close to three hundred entries between them, a glossary of financial-statement line items, a chapter-by-chapter list of the data that can mislead you, and the reminders that matter most. Every figure was drawn by the author; not one is a screenshot of any real application.
To be clear about what this book is not: it is not about picking stocks. It recommends, rates, and implies no specific stock, ETF, fund, or other financial product; it forecasts no prices, promises no returns, and gives no investment, tax, or legal advice. Every example uses a fictional company, ABC, and a fictional fund, XYZ, and every figure in those examples was invented to make a point. When the book says a number can mislead you, it means the limits of reading that number-not that you should do the opposite.
For anyone who has just opened an account and has no idea where to start on a screen full of numbers-and for anyone who has watched the market for years without ever finding out where those numbers actually come from.


Informácie o knihe
Angličtina

Darujte túto knihu ešte dnes
Je to jednoduché
1 Pridajte knihu do košíka a vyberte možnosť doručiť ako darček 2 Obratom Vám zašleme poukaz 3 Knihu zašleme na adresu obdarovanéhoAhoj! Som Libroamiko, tvoj knižný radca.
Ako ti môžem pomôcť?